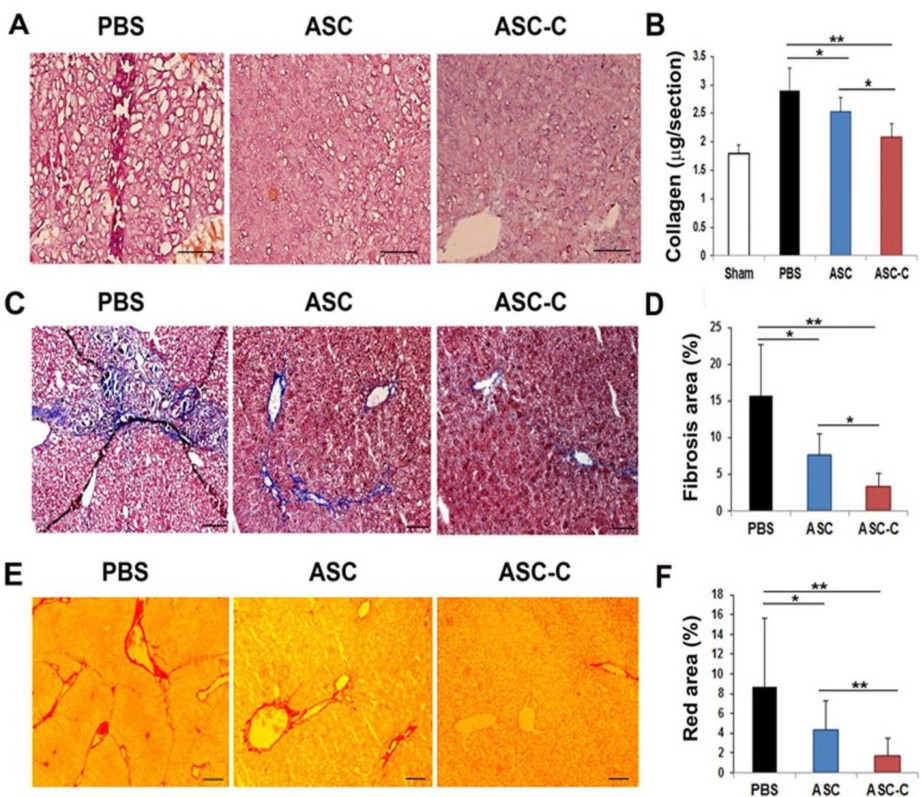
Fig. 7. In vivo therapeutic effects of ASC-C in acute liver failure mice model. (A) Representative H&E staining of liver sections after cell transplantation. PBS- and ASC-treated livers showed a distorted hepatic architecture compared with ASC-C-treated livers. Bar = 100 µm. (B) Quantitative analysis of collagen from liver tissues. The hepatic collagen content was measured using Sirius red/fast green collagen staining. Sectioned samples were fixed in Kahle's fixative, and the sections were stained in dye solution and mixed with a dye extraction buffer. The dye solutions were collected and their O.D. values were read by a spectrophotometer. n = 6 per group. **p<0.01; *p<0.05. (C) Representative images of fibrosis by Masson's trichrome (MT) staining after cell injection. Bar = 100 µm. (D) Quantitative analysis of the fibrotic area by MT staining. n = 6 per group. **p<0.01; *p<0.05. (E) Representative images of Sirius red staining after cell injection. (F) Quantitative analysis of the area of hepatic fibrosis by Sirius red staining. n = 6 per group. **p<0.01; *p<0.05. Bar = 100 µm.